£5.00
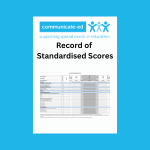
It is often helpful for those reading a report if scores are represented visually on a chart. This Excel document will help make the task quicker, easier and more accurate. When you type in a score a cross appears in the appropriate cell. (Including SASC level descriptors and updated report format assessment areas). Excel and PDF introduction. Updated for 2025/26.